When the pandemic first hit, The Associated Press was in a unique position to help its members — and their readers — understand all the different metrics and data points that quickly became part of the global vernacular.
AP’s data team — in collaboration with local reporters and the health and science beat team — approached this in two ways:
AP’s membership is made up of newspapers large and small. They have varying levels of data literacy and time to spend on data journalism. AP had to ensure its journalism was packaged in a variety of ways to best serve the entire community.
Let’s use weekly unemployment metrics as a case study to show how AP focused on three key delivery mechanisms:
Natural language generation
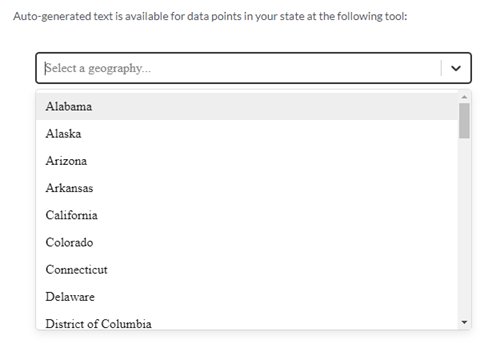
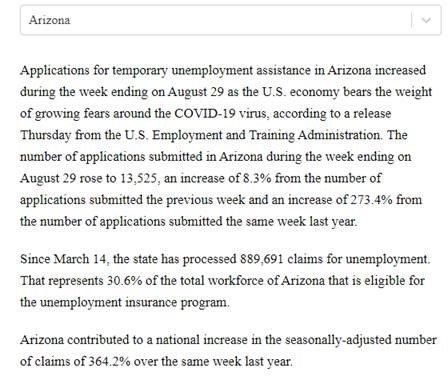
For newspapers that don’t have the skillset — or even just the time — to explore and analyze unemployment data every Thursday at 8:30 a.m. ET, the AP created a small application that automatically generates localized leads. Reporters and editors can select their state from a drop-down list and within milliseconds, the application produces a four-paragraph localized lead. It can be run independently or used to top off AP’s weekly national story on unemployment.
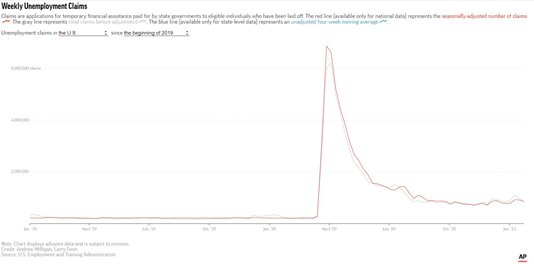
One of the best ways to present data to your audience is by visualizing it — whether it be a map, a chart or a lookup table. It puts the user in control, letting them further explore.
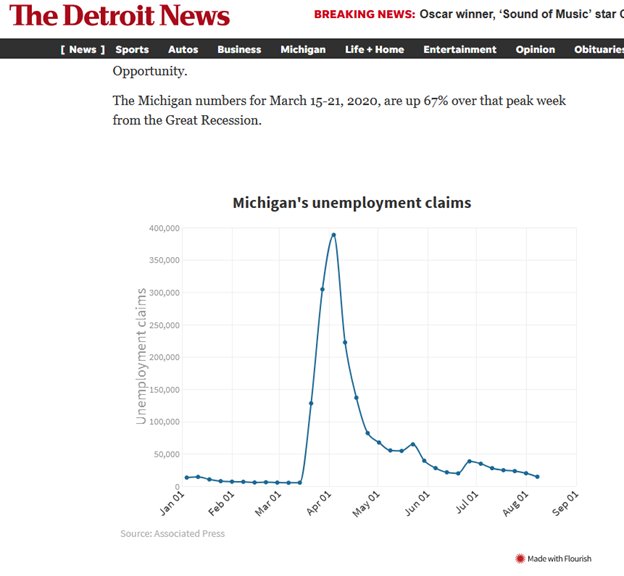
AP created a data visualization to track the weekly unemployment metrics. Member newspapers are given several customization options — they can show the national metrics or metrics specific to their state; they can also choose the timeframe to display.
Raw data
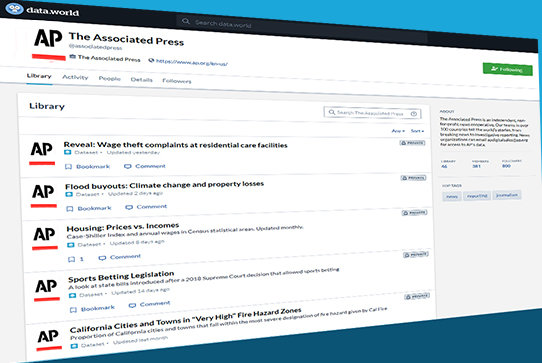
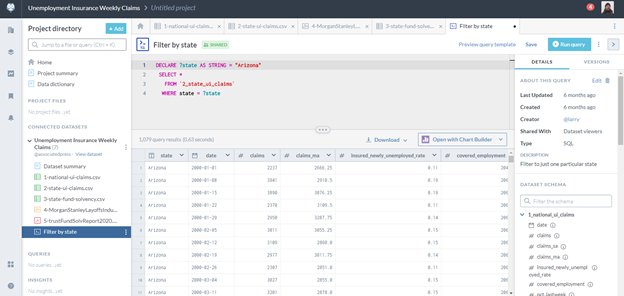
AP also wants to continue to cater to newsrooms with intermediate and advanced data skills. Through a collaboration with enterprise data catalog data.world, the AP delivered cleaned and vetted data with pre-written queries, detailed methodology and story suggestions. Newspapers can slice and dice the data to identify how national trends impact their local communities.
Throughout the pandemic, AP has released dozens of datasets — most exclusive to subscribers of AP’s data service and some made available at no cost as a public service. They cover everything from hospital capacities and COVID testing results to the impact of COVID in prisons and an investigation into the departure of public health officials. As the vaccine rollout continues, AP will be there to provide fact-based data on the status and equity of the rollout.
“AP’s data journalism helps newspapers take important national stories and put them in the context of their local communities,” said Ken Romano, the AP’s director of product. “Data is rooted in fact, and it’s the best way to ‘show your work’ and communicate the complex issues affecting us today.”
To get more information about this or other AP services, please go to https://www.ap.org/contact-us/.